
1. Engineering problem and analytical method
An underbody suction system modifies vehicle surface pressures through controlled airflow to produce aerodynamic loads suited to handling objectives. Powered ducted fans introduce a separate energy input, so benefits and costs must be assessed across aerodynamics, electric drive and vehicle duty. The central engineering question is how a fan and underbody passage can be matched within installation and electrical-power constraints to maintain a target pressure distribution as operating conditions change.
The review uses three evidence layers: architecture and interfaces directly disclosed in the patent; general pressure-integration, fan-performance and energy-balance methods; and calculations with explicitly assumed inputs. Figure and claim numbers locate technical features. Models establish evaluation relationships, while examples illustrate scale and sensitivity. No Tesla or Yuntu measurements from this automotive configuration are used.
2. Disclosed architecture: inlets, diffuser and fan array
US 12,746,987 B1 names Tesla, Inc. as applicant, with a January 17, 2024 filing date and January 17, 2023 provisional priority date. The architecture connects an underbody inlet to a rear outlet through a diffuser passage, with high-voltage battery and vehicle-control interfaces. Table 1 maps disclosed elements to engineering questions and their location in the document [1].
| Document location | Disclosed element | Engineering significance |
|---|---|---|
| Claim 1; Figures 1–2 | Underbody inlet, larger rear outlet, fans and outlet strakes between adjacent fans. | Assess inlet suction, diffusion and outlet flow together rather than inferring performance from fan count. |
| Claims 2–3; Figure 1 | An additional diffuser can use a rear underbody raked plate. | Compare fan-on and fan-off states to separate active and passive contributions. |
| Claims 4 and 13 | The passage extends substantially upward toward the outlet. | Retain outlet direction and rear pressure effects in vehicle force accounting. |
| Claims 10–14; Figure 3B | Side inlets behind the main inlet; some embodiments route inlets to different fan groups. | Air sources, recirculation and passage allocation affect the useful suction region. |
| Claims 5–9 and 15; Figure 4 | Battery and controller connections; user input or detected conditions can enable operation. | Assess power allocation and load transients; closed-loop performance is not reported. |
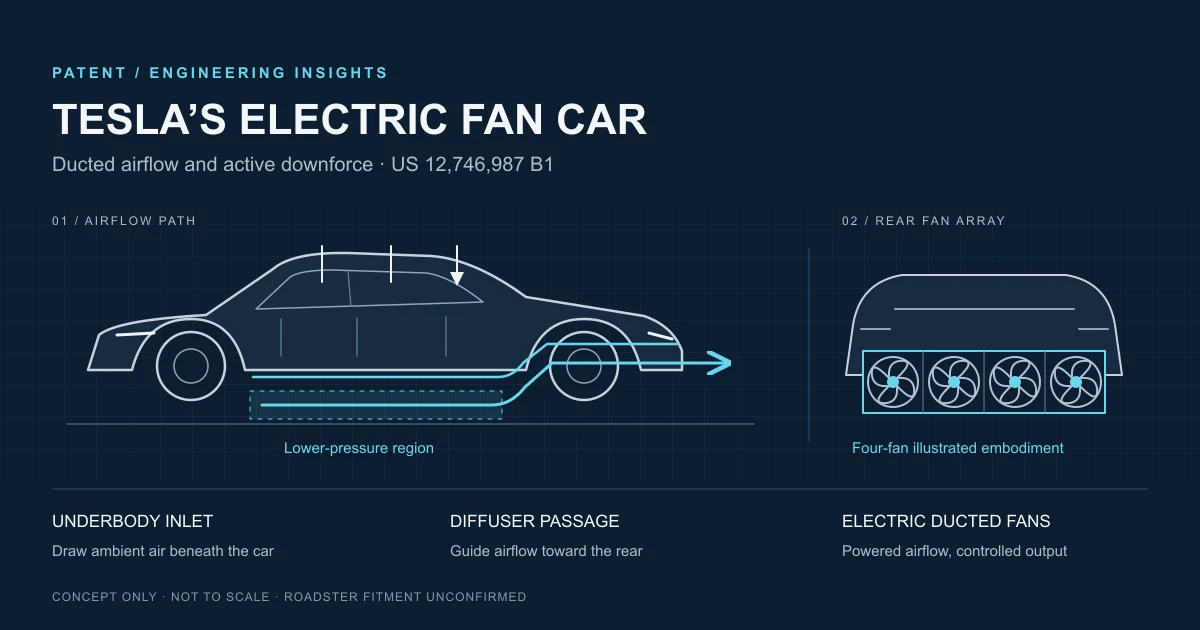
Column 3 explains that the Figure 3B side inlets reduce the main inlet’s tendency to draw air from behind the car. Total fan flow therefore differs from flow acting on the intended underbody region. The description also includes embodiments without extra road-contacting skirts and a higher outlet affecting pressure above the vehicle. These features require a complete flow-field assessment rather than a uniformly evacuated sealed-box model [1].
3. Downforce mechanism and pressure-load model
3.1 Defining the fan-induced load increment
Compare fan-on and fan-off states at the same speed, clearance and attitude to distinguish active effects from baseline aerodynamics. Define local pressure reduction as Δp(x,y) = p_off(x,y) − p_on(x,y). For an approximately horizontal underbody region, the pressure reduction corresponds to an additional downward load, estimated by Equation (1). NASA describes the underlying surface-pressure integration method [3].
Pressure magnitude and loaded area are separate design variables. Stronger local suction need not increase the pressure integral if the low-pressure region contracts. Pressure taps should therefore cover the region ahead of the main inlet, the side-inlet regions and the rear, rather than using a single minimum pressure as a proxy for total load. Rear external pressures and the installed system’s force contributions also matter when the outlet points upward.
3.2 Low-speed capability and spatial load distribution
With approximately constant aerodynamic coefficients and attitude, passive loading scales with dynamic pressure ρV²/2. Powered fans can maintain airflow at low vehicle speed, but low-speed loading does not establish insensitivity to speed, clearance or attitude. Incoming flow, underbody throughflow and wake conditions change the operating point; fan activation may also shift the centre of pressure. Front and rear axle load increments and pitching moment should be assessed alongside total downforce [3].
4. Operating point, parallel fans and electrical power
4.1 Matching pressure rise to flow demand
Rated RPM, free-air flow and aviation static thrust do not independently determine installed performance. Equation (2) expresses the match between fan characteristics and system demand. Besides flow, demand depends on clearance h, speed V, inlet and outlet boundaries, and specified passage geometry. The DOE/AMCA sourcebook provides general methods for fan curves, system curves and installation effects [2].
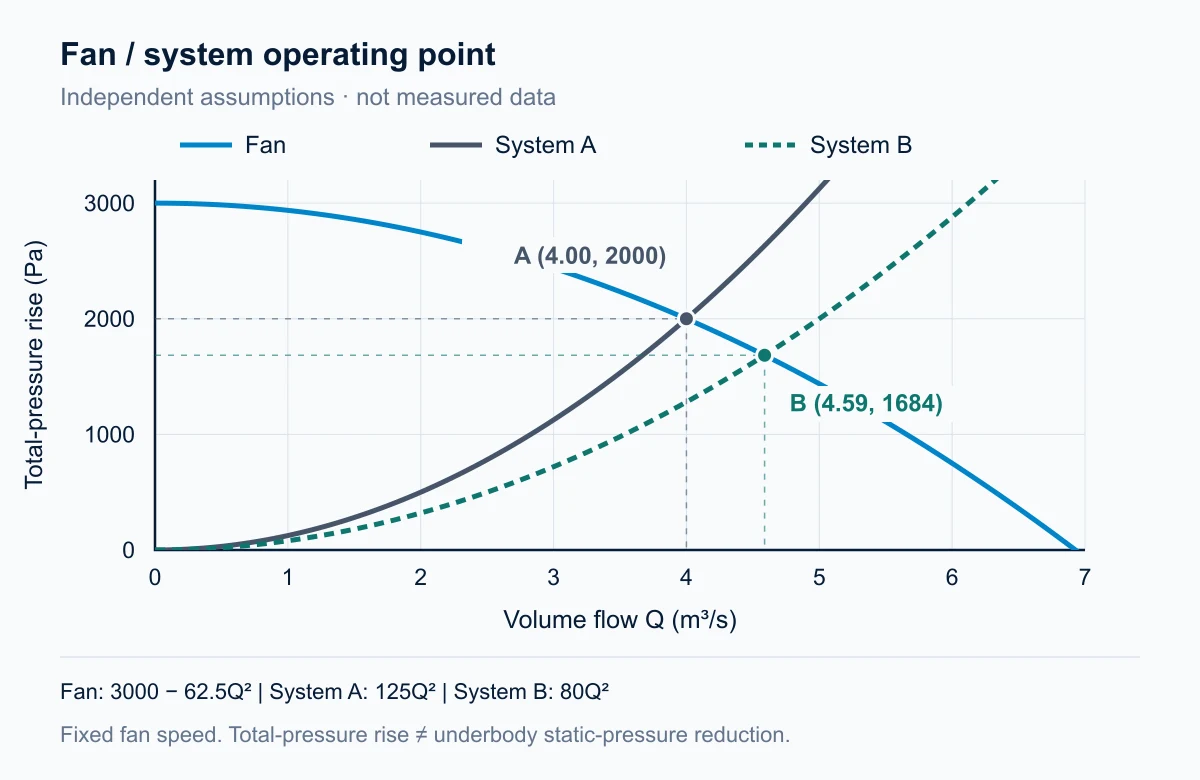
On the assumed fixed-speed curve, reducing equivalent resistance from A to B moves the operating point toward higher flow and lower pressure rise. More flow therefore need not mean more downforce. Three-dimensional inlets and external flow may prevent an actual underbody system from following a single quadratic demand curve. Installed measurements or validated flow calculations should establish its characteristics.
4.2 Fan arrays and local operating conditions
Figure 2 of the patent shows four fans, while the description permits other counts and routes some inlets to separate fan groups. Under common pressure boundaries, uniform inflow and negligible interference, Equation (3) gives an ideal parallel approximation. Parallel fans primarily add flow capacity at a given pressure rise; pressure rise is not multiplied by fan count. Partitioned passages, distorted inlets and rear interactions require separate unit operating points [1], [2].
4.3 Air power and the electric-drive efficiency chain
At low Mach number, negligible density change and approximately steady conditions, air power can be estimated as flow multiplied by fan total-pressure rise. Electrical input includes fan, motor and inverter losses. Efficiency definitions must be consistent with total- or static-pressure conventions [2].
Selection should use pressure–flow–speed and efficiency maps, checked against installed boundaries. Aviation EDF static thrust describes axial force under its specific test conditions. Automotive active aerodynamics instead requires a target pressure distribution and adequate flow supply. The applications share fan and electric-drive methods, but their performance metrics have no direct proportional conversion.
5. Clearance and boundary-leakage sensitivity
An underbody low-pressure region without ideal sealing depends on surrounding air-entry paths. For a first sensitivity estimate, represent a short leakage gap as an equivalent orifice, as in Equation (5). This is a simplified model introduced here, not a model of the patent’s three-dimensional underbody flow. Friction, inlet contraction and nonuniform gaps need measurement-based corrections.
| Equivalent gap h | Opening area Lh | Estimated Q_leak | Relative to 10 mm |
|---|---|---|---|
| 10 mm | 0.060 m² | 1.93 m³/s | Baseline |
| 15 mm | 0.090 m² | 2.89 m³/s | +50% |
| 20 mm | 0.120 m² | 3.86 m³/s | +100% |
Table 2 assumes L = 6 m, C_d = 0.65, ρ = 1.225 kg/m³ and a 1500 Pa pressure difference. Increasing the opening raises replenishment demand if the target pressure is maintained; it does not demonstrate that a real fan can maintain it. At fixed RPM, flow and pressure will re-equilibrate. Clearance, suspension compression, pitch and roll therefore belong in the system inputs rather than only the installation drawing.
6. Illustrative calculation: loading and vehicle energy cost
6.1 Inputs, calculation and applicability
The following low-Mach, approximately steady example makes the relationships reproducible. Mean underbody pressure reduction and fan total-pressure rise are separate inputs. Dimensions are not inferred from patent drawings, and automotive capability is not inferred from an aviation product. Specifying a calculated duty point does not demonstrate that suitable hardware exists.
Load and electrical power for a 2 m² effective region
Scenario: Assume nearly uniform underbody pressure reduction and negligible upper-surface changes. Fan total-pressure rise is set 500 Pa above the mean underbody reduction; this is an assumed additional net head for this example, not a universal conversion.
- Equation (1): ΔF_p ≈ 2.0 × 1500 = 3000 N, approximately 306 kgf. kgf is force, not vehicle mass or additional payload.
- Equation (4): η_sys = 0.70 × 0.94 × 0.97 = 0.63826; P_e,fan ≈ 4.0 × 2000 / 0.63826 = 12.53 kW.
- At unchanged conditions for 60 s, fan energy is approximately 12.53 × 60 / 3600 = 0.209 kWh, excluding additional cooling and auxiliaries.
| Mean pressure reduction | Assumed fan pressure rise | Local load increment | Fan electrical input |
|---|---|---|---|
| 1000 Pa | 1500 Pa | 2.00 kN | 9.40 kW |
| 1500 Pa | 2000 Pa | 3.00 kN | 12.53 kW |
| 2000 Pa | 2500 Pa | 4.00 kN | 15.67 kW |
Table 3 holds Q = 4 m³/s, A_eff = 2 m² and η_sys = 0.63826, retaining the assumed 500 Pa additional net head. It compares specified duty points, not a fixed-speed trajectory on one fan curve. Realizing each point requires a speed and performance-map check. If middle-point efficiency falls to 0.50 at unchanged flow and pressure, electrical input becomes 16.0 kW, about 27.7% higher, with the Equation (1) pressure load unchanged.
6.2 Drag reduction versus electricity reduction
Reduced drag is a patent design objective, but vehicle electricity use also includes fan input. At equal steady speed, define ΔD = D_on − D_off, positive for added drag. Equation (6) follows from mechanical power D×V and drive efficiency. This first-order derivation excludes acceleration, changes in tyre losses and additional thermal-management loads.
With 12.53 kW fan input, 100 km/h (27.78 m/s) speed and η_drive = 0.90, approximately 406 N of drag reduction would offset fan power. This threshold comes only from assumed inputs; the patent provides no matching drag data. At lower speeds, a given drag reduction saves less propulsion power. Handling and energy should therefore be evaluated by duty rather than equating more downforce and less drag with longer range.
7. Integration and validation from unit maps to vehicle loads
Yuntu’s assessment sequence in this review starts with target loads and duty, establishes installation boundaries and power budgets, then matches fan and drive combinations to the operating envelope. This links component performance to system demand and identifies data needed before prototype validation. Table 4 outlines a measurement programme for the disclosed architecture.
| Level | Controlled or measured conditions | Decision outputs |
|---|---|---|
| Fan and electric drive | Density, RPM, total pressure, flow, voltage/current and temperature; measurement uncertainty. | Pressure–flow and efficiency maps, continuous-duty temperature rise and abnormal-condition boundaries. |
| Installed passages | Inlet distortion, diffuser separation, passage allocation and outlet direction; consistent pressure conventions. | Installation losses, unit operating points, pressure recovery and flow distribution. |
| Vehicle aerodynamics | Fan-on/off comparison at equal speed; clearance, pitch, roll and crossflow sweeps. | Surface pressures, total downforce, axle increments, pitching moment and drag change. |
| Control and power coupling | Switching, power limitation and unit failures; load build-up and decay. | Response time, load-change rate, centre-of-pressure movement and coordination requirements. |
| Environment and endurance | Water, debris and guards; noise at declared distances and duty; drive thermal equilibrium. | Degradation, acoustic spectra, protective-device pressure loss and maintenance needs. |
CFD assessment should declare the fan-performance input, moving-ground and inflow boundaries, resolve the relevant clearances and check mesh sensitivity. A simplified pressure-jump representation may support overall matching, but does not establish blade-scale unsteady flow or acoustic performance. Match calculations to pressure, flow and vehicle force measurements rather than treating streamlines alone as validation.
Rapid downforce changes may affect tyre normal loads and pitch response. Unit-failure tests should measure lost load, its distribution and decay rate before the vehicle team assesses coordination. Total downforce has no fixed proportional conversion to cornering speed or stopping distance; tyre load sensitivity, road conditions and vehicle dynamics also govern those outcomes.
8. Engineering conclusions and transferable design methods
- Assess installed pressure distributions and integrated loads; fan count, RPM and isolated thrust do not independently characterize vehicle performance.
- Fan total-pressure rise and underbody static-pressure reduction are different metrics. Relate them through the complete passage and external flow field, with consistent efficiency definitions.
- Clearance and attitude affect inlet boundaries and operating point. Include them in the aerodynamic envelope; higher flow may accompany lower pressure rise or efficiency.
- Evaluate handling and net energy separately by duty. Fan consumption, drag change, continuous operation and load transients jointly determine integration value.
The transferable method for aviation and other installed ducted-fan projects is mission requirements, installation boundaries, unit maps and system validation. Aviation targets thrust and mission energy; automotive active aerodynamics targets pressure loads and handling. Shared component concepts do not imply shared operating conditions. See the electric ducted fan technology hub and UAV electric-propulsion sizing guide.
For constrained installations or nonstandard air paths, first specify flow, pressure rise, envelope, voltage, continuous duration and acoustic boundaries, then discuss matching through the custom electric ducted fan service. This is Yuntu’s independent review of public material. Aviation product links are technical references and do not imply Tesla collaboration or validated automotive fitment.
Supplementary engineering questions
Is the next-generation Roadster confirmed to use this EDF patent?
Not as of September 30, 2026. US12746987B1 does not name the Roadster. Disclosed architecture and production vehicle equipment require separate verification.
Do four parallel fans produce four times the pressure rise?
Under common pressure boundaries, ideal parallel fans primarily add flow capacity; pressure rise is not multiplied by unit count. Different inlets and passages require individual operating-point assessment.
Where do the 3 kN and 12.53 kW figures come from?
They are calculated from explicitly assumed area, pressure, flow and efficiency. They illustrate a method, not Tesla or Yuntu measurements of this automotive configuration or a performance prediction.
Can aviation EDF static thrust be converted directly to car downforce?
No direct conversion exists. Unit static thrust and vehicle pressure loading are different system metrics. Installed passages, pressure distribution and complete forces must be related.
Does this patent establish cold-gas propulsion or hovering?
It describes electrically driven fans processing ambient air, without disclosing cold-gas integration or hovering capability. Cold-gas systems release stored pressurized gas through nozzles; their energy and working-fluid supply differ.
References and analytical boundaries
[1]Tesla: Electric Fan Car, US 12,746,987 B1
USPTO document; PDF mirror of the same document. Review scope: front page, specification columns 1–4, claims 1–15 and Figures 1–4. Used to locate architecture, not infer production performance.
[2]DOE / AMCA: Improving Fan System Performance
Fan-system sourcebook. Relevant sections include printed pages 6–8 on curves and efficiency, system leaks and multiple-fan arrangements. General methods inform the framework; industrial fan data are not used to predict Tesla performance.
[3]NASA Glenn: Aerodynamic Forces
Surface-pressure integration. Background for pressure loads; local underbody approximations and example assumptions are defined separately here.
[4]NASA: Cold-gas propulsion material
NASA technical record. Used only to distinguish stored-gas discharge from fans continuously ingesting ambient air.
[5]Roadster event-date reporting
Drive Tesla, September 28, 2026, citing Tesla’s rescheduling announcement. Used for information status, not technical models.
Sources checked: September 30, 2026. Conclusions are bounded by the stated model conditions and assumptions. Assessment of a later production architecture requires its geometry, operating conditions and measured data.